
 Tutorials Tutorials | (back to the list of tutorials) |
 Points and Vectors
The difference between a vector and a point is often explained that a point represents an absolute location in XYZ coordinate space and a vector represents a relative location from a certain point to another point. Because of this, a vector has a direction and a length and visualized as an arrow but doesn't really have a location in space to be visualized.
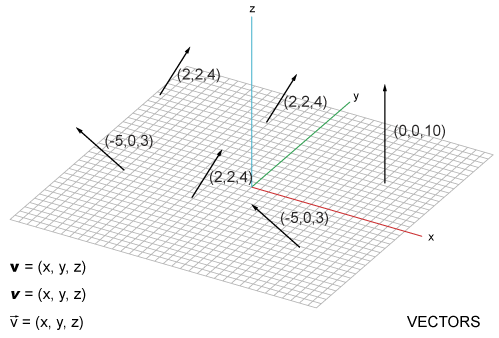
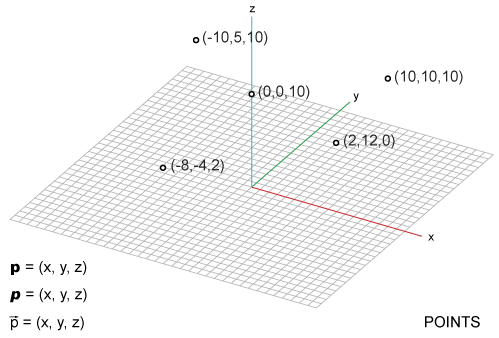
On the other hand, a point has an absolute location in space to be visualized.
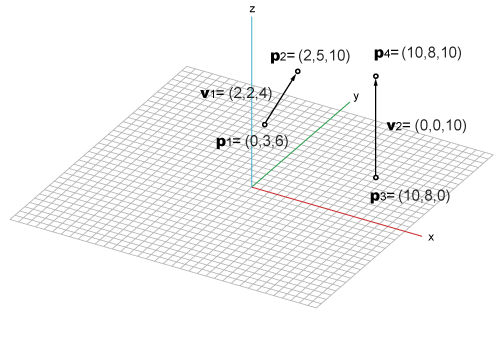
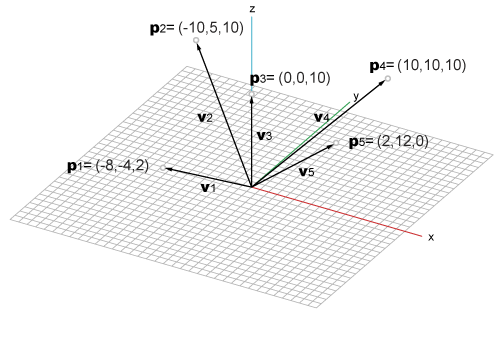
Then a vector can be visualized as a difference of two points and the below shows the relationship between a point and a vector.
However, this difference of a vector and a point is
really just up to how you interpret a set of three number.
If you see a vector as an arrow whose root is at the origin, this vector can be read as a specifier of an absolute location, which is a point.
And vice versa. If you see a point as difference between the location of the point and the origin, this point can be read as a vector.
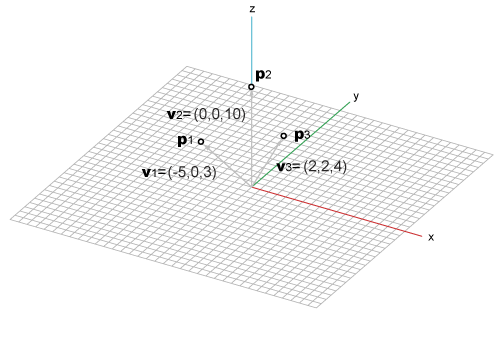
So, they have only conceptual difference in interpretation and as numerical data, they are same and the same mathematical operations can be applied to the both.
The geometry system of iGeo is built on this perspective and a point and a vector are represented by the same data structure and exchangeable.
The fundamental vector class in iGeo is IVec. The IPoint class we've already seen is actually one type of IVec. The major difference between IPoint and IVec is that IPoint has a graphical representation in 3D space but IVec doesn't (However you can visualize a vector not as geometry object but just as annotation. See the section below). IPoint is also a geometric object stored in the iGeo server and can be saved in 3D modeling files but IVec is just seen as numbers and not directly stored in the iGeo server nor saved in files (but indirectly as part of other geometric objects).
However, IVec is more important because all geometric objects like curves, surfaces and polygon meshes in iGeo are constructed with IVec and using IVec is the most efficient way to create those geometries.
IVec Class
![]()
![]()
![]()
![]()
import processing.opengl.*;
import igeo.*;

size( 480, 360, IG.GL );

IVec v1 = new IVec(0, 0, 0);
IVec v2 = new IVec(10, 20, 30);
When you run this code, it will show no object because IVec itself doesn't have graphical representation.
There are several more ways to create an instance of IVec other than new IVec(). The following expressions using methods of IG class, IG.vec() and IG.v(), can also create an instance of IVec.
![]()
![]()
![]()
![]()
import processing.opengl.*;
import igeo.*;

size( 480, 360, IG.GL );

IVec v1 = IG.vec(0, 0, 0);
IVec v2 = IG.vec(10, 20, 30);
![]()
![]()
![]()
![]()
import processing.opengl.*;
import igeo.*;

size( 480, 360, IG.GL );

IVec v1 = IG.v(0, 0, 0);
IVec v2 = IG.v(10, 20, 30);
Creating Geometries with Vectors![]()
![]()
![]()
![]()
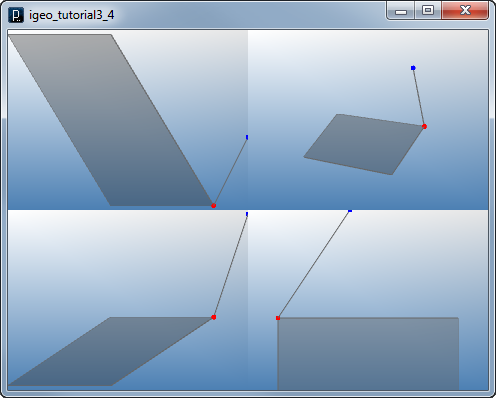
import processing.opengl.*;
import igeo.*;

size( 480, 360, IG.GL );

IVec v1 = new IVec(0, 0, 0);
IVec v2 = new IVec(10, 20, 30);

new IPoint(v1).clr(1.,0,0);
new IPoint(v2).clr(0,0,1.);

new ICurve(v1,v2);

IVec v3 = new IVec(-30,0,-20);
IVec v4 = new IVec(-60,50,-20);
IVec v5 = new IVec(-30,50,0);

new ISurface(v1,v3,v4,v5);
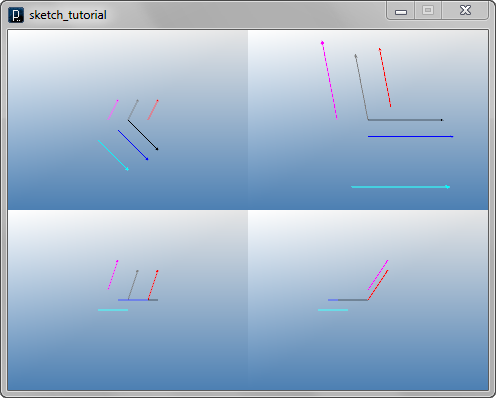
Visualize Vectors as Arrows![]()
![]()
![]()
![]()
import processing.opengl.*;
import igeo.*;

size( 480, 360, IG.GL );

IVec v1 = new IVec(10, 20, 30);

// showing the vector at (0,0,0) (gray)
v1.show();
// showing the vector at (20,0,0) (red)
v1.show( new IVec(20, 0, 0) ).clr(1.,0,0);
// showing the vector at (-20,0,10) (magenta)
v1.show(new IVec(-20, 0, 10) ).clr(1.,0,1.);

IVec v2 = new IVec(30, -30, 0);

// showing the vector at (0,0,0) (black)
v2.show().clr(0);
// showing the vector at (-10,-10,0) (blue)
v2.show(new IVec(-10, -10, 0)).clr(0,0,1.);
// showing the vector at (-30,-20,-10) (cyan)
v2.show(new IVec(-30, -20, -10)).clr(0,1.,1.);
HOME
FOR PROCESSING
DOWNLOAD
DOCUMENTS
TUTORIALS (Java /
Python)
GALLERY
SOURCE CODE(GitHub)
PRIVACY POLICY
ABOUT/CONTACT
